


My experience digitizing historical sources with politicized histories
By Lotem Halevy
For the last two and a half years, I have been collecting, compiling, and digitizing data for my dissertation. In this post I highlight how I created a time-series of 19th century Hungarian elections. The post is not meant to narrate best practices for historical data digitization. Instead, it is meant to describe my personal experience digitizing data when both the process that generated the primary source is unreliable and when the source is not in the most conventional form. Specifically, I digitized a series of high politicized electoral maps.
For context, in my book-length dissertation project I study the causes and consequences of universal male enfranchisement; specifically, how the different pathways to mass enfranchisement affected the development of democratic party systems. I investigate how incumbent party elites (liberal and conservative party leaders) and leaders of extra-parliamentary parties (e.g., worker, agrarian, ethno-nationalist, and Christian Social parties) used a combination early social service provision and electoral reforms to secure a voting base in the democratizing era, and the consequences of this on party systems during the post-democratic period.
I wanted to focus on the constituent states of the Austrian-Hungarian Empire for this project. But when I had to write my prospectus and was looking for data to generate the elusive “puzzle figure”, I was shocked at just how little data existed. I couldn’t find voting records, census records, or really any quantitative data that stretched back to the 19th century. But from years of reading the political histories of the various states I knew that there was a story to tell.
Many scholars, including contributors to this blog, have talked about the ethical implications of HPE research, especially when it comes to working with colonial data and data involving political violence. I urge the reader to consider these discussions before digitizing and working with historical data. This post is not about the ethical issues concerning data usage. Rather, I detail lessons I learnt through digitizing a historical source — electoral maps, while acknowledging the complicated history and process that generated it. Several times in this post, I reference my digitization of Hungary’s historical census records (1870-1910), I do this to highlight how to create a historic dataset apt for analysis you often need to digitize and merge several data sources.
Lesson 1: Start as early has you figure out what data you will need to answer your question. Everything, not just historical research, takes longer than you except. I first tried to consider the research design and figured I would need electoral returns at the subnational level. From background research I knew that throughout the period I was interested in the franchise in the Kingdom of Hungary was not only extremely limited but also uneven across space and I wanted to figure out how electoral competition factored in.
Lesson 2: Before you start digitizing data check footnotes, replication files and appendixes of relevant works to make sure the data are not already available. Check disciplines outside your own; when I started this project, I found that research methodologies might differ, but the data of interest often remain the same across fields. Try and figure out what digital libraries and repositories the local academies use. For example, I found that in Hungary lots of research is uploaded to the Repository of Hungarian Scientific Works and not Google Scholar.
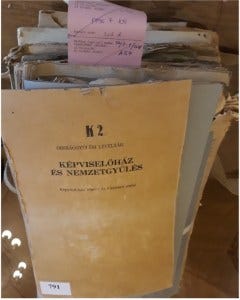
But I still couldn’t find a source that digitized the 19th century pre-secret ballot call logs or electoral records from the Kingdom. In the Summer of 2019, I travelled to the archives; I located the parliamentary records in the National Archive’s online directory which supposedly held the call logs (before the secret ballot) for the pre-democratic 19th century elections.
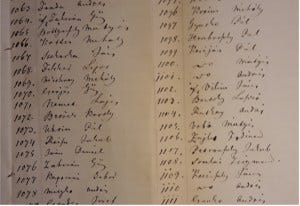
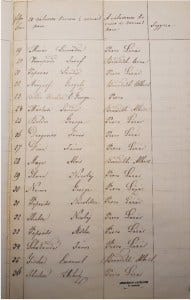
What I found in Budapest was a somewhat water-damaged drawer with thousands of pages, most of which were out of order (meaning I would have to manually sort the logs to the district by figuring out which electors lived where). I had no way of knowing if and what pages were missing, but I also learnt my eyes, nor an OCR could decipher 19th century Hungarian handwriting.
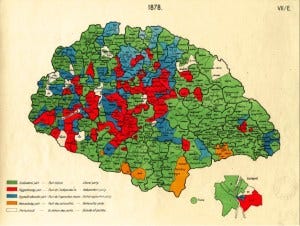
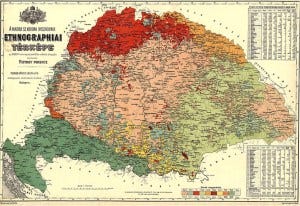
Lesson 2: Archivists are there to help. I told one of archivist about the data I was on the search for. He asked if I had heard of the electoral maps created by Fodor Ferenc and pulled out a laptop to show me the data source that would become base of the Kingdom of Hungary’s digitized electoral records.
Lesson 3: Try and figure out as much as you can about the politics involved in generating the data you are attempting to digitize. I tried to learn all I could about the maps: Who was Fodor Ferenc? Who commissioned a professor to make the maps and why? When was the process of compiling the maps started? Finished? What was the source of the data? How did he deal with by-elections? Did he account for redistricting?
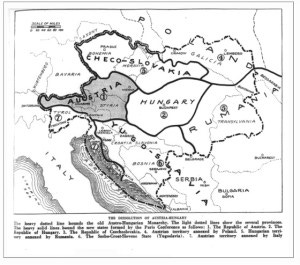
The maps were commissioned by the government prior to the Treaty of Trianon negotiations to “gauge interest” in the various national groups’ support for independence across Hungary’s multinational electoral districts. This was a highly politicized cartographic process that was carried out by a group of nationalist Hungarian geographers with close ties to parties who vehemently opposed the eventual division of Hungary.
Regardless, the source presented an opportunity for time-series cross-sectional analysis of Hungary’s electoral districts during the pre-democratic era. I figured there would be errors, but I wanted to correct the errors before running any analyses. I decided to systematically try to understand the reliability of the data. (For a thorough discussion of several of the issues associated with working with historical data see: Cirone and Spirling 2021).
Lesson 4: Systematically track your observations, give each observation at every level of analysis a unique ID. You might have to merge several digitized historical datasets before you are able to run analyses, and the level of analysis might differ across variables. For example, by the time I found the maps, I already started to digitize the census records for the Kingdom which were at the county level. Because the maps are at the district level, I needed to also create a unique ID for the counties in which districts were embedded to merge the two historic datasets together. Lucky for me, the appendix for an Archontology for the Dualist period in Hungary by Dániel Ballabás, József Pap, and Judit Pál (2020), has a list of all counties and their embedded districts.
Lesson 5: Figure out the most logical way to extract information from the source you are digitizing to minimize work for yourself. I started with a blank sheet in Excel, then loaded the data from the Archontology. I sorted the counties to match the census records (to make merging easier) and gave each district and county a unique ID, using the same IDs for the counties as the IDs for the counties in the census data.
After creating a codebook of the different colours/parties in the source maps, I printed out the source maps and digitized district by district by recording the party that won each district in each year in the Excel sheet, then colouring the district in black when I finished to track which district I already recorded.
Comparatively, when I digitized the censuses for Hungary, I went column by column, page by page. Dawn Teele taught me to digitize every column. Not only is it easier to not skip columns, but you also never know what additional controls you might need or what reviewers might ask for.
Next, I had to figure out if the source maps tracked the districting changes that the Archontology appendix documented and if the results on the maps were accurate.
Lesson 6: Triangulate and validate the source, consider the political process that generated the data; even official statistics can be inaccurate. Do not drop observations from the raw data. This is especially true when it comes to “counting people”. There were periods of redistricting in Hungary, so some districts effectively enter and exit the data at different times. Because these changes are endogenous to the outcome of interest — the district’s election winner, dropping the districts that were redistricted could introduce bias to any estimates. Instead, I created two variables: an indicator if the Archontology indicated redistricting, and an indicator if the change was reflected in the source maps.
Lesson 7: Use the labour of historians to your advantage. For me, I used the work of several historians with regional specialities to triangulate the data in the maps. However, I did not randomly sample districts to validate because ex-ante I did not think that there was much randomness in the Cartographer’s “mistakes”.
I had a hunch that redistricting, and by-elections served a political goal.
To accompany the list of districts and counties that underwent redistricting from the Archontology, I compiled a list of all the by-elections that occurred in the Kingdom throughout period covered by the maps (also available from Archontology’s appendix). My hunch was that the more elections (or redistricting) a district experienced the more competitive or threatened the incumbents were and therefore the more likely the data in the source map was to be “wrong”.
Consulting the two lists and a list of all majority-minority counties (from the digitized censuses), I tried to find out as much as I could about the results for the counties that appeared on at least one of the three lists. I created two new variables. The first that tracked if there was an error in the result recorded in the map and the second, tracked the type of error. Some examples of “errors” included: by-election recorded, wrong result, district is two districts and only one result listed, and representative elected has no party and recorded as “missing”.
Lesson 9: I found that I made heavy use of comments to myself while I was working on validating the data. It was a slow process and I rarely got through more than 5 or 6 districts in a single day, and I wanted to not forget what I did each day (there are a total of 484 districts across the coverage period). Give your sheets or scripts informative names and do not make changes to the original data; always save a copy of the raw digitized data.
I am currently in a position where I can merge two datasets that I digitized: electoral records and census records. But because of the politics involved in processes that created the data, specifically the endogeneity with the outcome I am interested in, the digitization of both datasets required much validation and triangulation after the source was initially digitized. I have little doubt that as I continue to work on this dissertation, I will have to go back and further triangulate results in the raw data, but at least for now I have sufficient confidence that I’ve managed to go through the 139 redistricting changes and the districts with more than 17 (mean is 15.87) recorded elections during the coverage period.
I had a lot of help in digitizing these data. Some of the digitization of the raw data was done by RAs. Some of the local histories were professionally translated and I consulted several Hungarian historians on local histories when I was not sure what was going on. All of this was made possible through my incredibly supportive co-chairs who never told me that this venture was a waste of time and instead poured resources into this massive data collection effort.
The lessons I outline, specifically apply to extracting quantitative data from images when web scraping, and more advanced machine learning techniques are not an option. For helping me to try and figure out if there was a more automatic way of doing this digitization, I thank the librarians in the Research Data & Digital Scholarship unit at the University of Pennsylvania Libraries and the Price Lab for Digital Humanities at the University of Pennsylvania.
I hope to release both the electoral and census data for much of the Dualist period after I finish and publish my dissertation.